According to the Rider Levett Bucknall Q3 2019 RLB Crane Index®, Sydney, Melbourne and Brisbane’s inner-city cranes have risen from 44% to 48% over the past six months, highlighting the movement of cranes from suburban to inner-city areas.
Domenic Schiafone, RLB’s Oceania Director of Research and Development said, ‘The ongoing changes in government’s infrastructure spending and planning schemes is evident as the location of cranes gravitate along key city transportation corridors and activity centres.’
The 15th edition of the RLB Crane Index found that Melbourne’s total crane count has contracted for the first time in three years, with a decrease of 9 net cranes since the previous edition six months ago. Across Melbourne, 94 cranes were added to projects and 104 were removed, to reach a total of 213.
Sydney meanwhile, at 319 cranes, offset these losses by increasing by a similar number (9) since the RLB Crane Index® March 2019 edition.
Wollongong makes RLB Crane Index® debut
The city of Wollongong in NSW has18 cranes across the city. Australia has now hit a new record of 739 long-term cranes, up 4 from the previous edition. If Wollongong is included in the total number, there are now 757 cranes across the country. One hundred percent of cranes removed from completed developments have been placed back onto new developments.
Industry defies predictions
According to the RLB Crane Index®, there were no cities recording crane falls in the double digits, a sign that the industry has not yet entered into the economic cycle of falling demand as predicted by some.
The residential sector suffered the most number of removals with a loss of nineteen cranes, but offsetting these losses were new cranes erected within the commercial (85), civil (37) and mixed-use sectors.
Sydney leading crane count
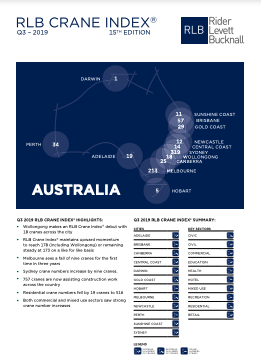
Looking around the country, Sydney continues to be the main driver of the crane count. There are 757 cranes across Australia: Sydney (319), Melbourne (213), Brisbane (57), Perth (34), Gold Coast (29), Canberra (25), Adelaide (19), Wollongong (18), Sunshine Coast (11), Newcastle (12), Hobart (5) and Darwin (1). The Sydney index rebounded from its previous three falls to record a 3% rise for this edition.
Domenic said, ‘Visually, cranes across Sydney appear to be following the significant spend on transport infrastructure in the past five years creating defined lines of activity. These are north along the Pacific Highway, west along Parramatta Road, northeast along the M2 and south along the Kingsway- and this is having a significant influence in the delivery of housing stock across Sydney.’
Residential sector remains strong
Residential cranes still dominate the city with 73% of all cranes assisting in the construction of future dwellings. Commercial cranes are the only other sector to have more than a 10% share of current cranes at 14%. No retail, mixed use or civic cranes were recorded for this edition.
There has been a significant shift of cranes across Sydney this edition. Activity has moved from the north to the east and inner Sydney. The South and the West have remained steady. Across the city, inner Sydney recorded a net crane gain of 12. This is a 10% increase for the six months.
Melbourne records its first fall
Melbourne recorded its first fall in six editions, falling by 3.6% to 184. It was the first fall since Q3 2016.
Across Melbourne 94 cranes were added to projects and 103 were removed, bringing current crane numbers to 213 down from the record 222 cranes achieved six months ago.
Solidifying the current strength of Victoria’s construction industry, construction work done rose 4.4% in chain volume terms for FY 2019, with increases recorded for all sectors. Engineering work done rose 3.3% as activity ramps up on many key infrastructure projects. The building sector increased
4.9%.
Residential dominates Melbourne skyline
There are 145 cranes across 43 suburbs in Melbourne which is down from 69 suburbs six months ago. A movement towards the CBD has taken place this period with 60% of all cranes centred on inner Melbourne.
Across the city, crane increases were only seen within inner Melbourne (5), all other regions saw crane reductions. The rise in cranes within inner Melbourne was driven by a strong increase in the residential sector of nine cranes. This was a result of 36 new cranes on projects and 27 removals. Residential developments now account for 64% of all cranes across inner Melbourne.
Brisbane’s cranes in decline
Since the high in Q4 2015, Brisbane has gradually declined reaching a level of 78 for this edition. Across Brisbane 32 cranes were added and 34 were removed, resulting in a total of 57 cranes, a decrease of two.
This decline is reflective of the fall in work done for FY 2019. Queensland’s construction volumes fell by 10% in chain volume terms. The residential sector fell by 6.6%, and the non-residential sector fell by 1.5%.
Perth index rising
Perth saw a rise in the RLB Crane Index® of 9% with the index now at 79. A significant 24 cranes were added in the past six months signifying strength in new commencements. Twenty-three cranes were removed from mostly residential projects. Thirty-four cranes can now be seen across Perth.
The Gold Coast records a fall
The RLB Crane Index® recorded a fall from 213 to 193 on the Gold Coast, a fall of 10%. Sixteen cranes were added and 19 were removed bringing the coast’s total to 29.
The residential sector accounts for 86% of all Gold Coast cranes, falling slightly from the previous edition. The residential sector saw 13 new cranes placed on sites and 18 removed, bringing the sector count to 25.
Adelaide continues to climb
Adelaide continues its upward trajectory increasing to 317, the highest value recorded. The increase was a result of eight new cranes starting on projects with six removed.
For further details of crane activity in each Australian city, please refer to the Q3 2019 RLB Crane Index®.
FURTHER INFORMATION: