According to today’s release of the Q1 2021 RLB Crane Index®, an increase in long-term construction cranes has been recorded across New Zealand over the past six months, with COVID-19 not adversely impacting the construction market as much as many had originally thought.
Rider Levett Bucknall (RLB) Director Chris Haines said, ‘Six months ago, we forecast that the real impact of uncertainty and a decline in forward workload and subsequent long-term cranes was more likely to be felt in 2021, subsequent to lockdowns and a period when all the key construction sites in Auckland were shut down.’
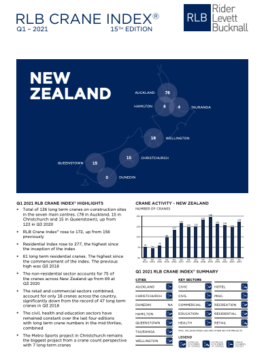
He noted, ‘Analysing the construction market now, we are in a much better position than we’d anticipated, with an increase in cranes sighted in each of NZ’s key construction centres, a new peak for residential cranes in Auckland and across the country, as well as a record number of cranes in both Queenstown and Wellington.’
All regions in New Zealand increase crane numbers
The Q1 2021 RLB Crane Index® found that there are currently 136 construction cranes working on key projects across the main centres in New Zealand (a net increase of 13 cranes from Q3 2020). The highest number of long-term cranes recorded to date was 148 in Q1 2019.
All regions of New Zealand within the index, saw increased crane numbers, with Queenstown and Wellington both seeing additional long-term crane numbers of four and three respectively. Queenstown’s index continued its rise to a record level of 15 cranes, despite the continued uncertainty in the hotel and tourism sectors.
Auckland leads the way
Looking across the country, Auckland remains the crane king with 78 cranes, Wellington recorded 18 cranes, Queenstown 15 cranes, Hamilton 6 cranes, Christchurch 5 cranes and Tauranga 4 cranes.
Chris continued, ‘The new peak in residential crane numbers highlights the strength of the sector. Sixty-one long term cranes are now on sites across New Zealand, including a record of 46 in Auckland, which will provide valuable housing stock into the market.’
‘The non-residential index had a bumpier ride and is currently 18% lower than the Q1 2019 peak. The non-residential sector accounts for 75 of the cranes across New Zealand, down from 85 in Q1 2020, but up from 69 at Q3 2020.’
‘The severe impact of continued border restrictions on tourism activity is reducing demand for the construction of largely new hotel tourism accommodation and retail work. With the government indicating borders will likely remain largely closed until 2022, we expect non-residential construction demand in these sectors will remain weak over the coming year,’ he added.
Retail and commercial sectors record major fall
According to the RLB Crane Index®, the retail and commercial sectors combined, account for only 18 cranes across the country, significantly down from the record of 47 long-term cranes in Q3 2018.
The civil, health and education sectors have remained constant over the last four editions with long term crane numbers in the mid-thirties, combined.
‘The civil sector had a constant 25 total cranes with 6 new cranes across CRL train stations and the Mangere Bridge replacement project together with 6 replacements elsewhere. We anticipate more of the ‘shovel ready’ projects will flow through into the next crane count in Q3 2021,’ Chris added.
The Metro Sports Centre in Christchurch currently has the greatest number of long term cranes in the country with seven cranes.
Auckland index rises for the first time since 2019 peak
Auckland’s RLB Crane Index® rose for the first time since the peak of Q1 2019 at the end of the last construction boom. The Q1 2021 index rose from 233 to 236. Long-term cranes across Auckland rose by 1.3% from 77 to 78.
The net increase of 1 long-term crane was a result of 23 removals and the addition of 24 new cranes across Auckland.
The small rise in crane numbers is not reflected by the decrease of building work put in place for the twelve months to December 2020. Auckland’s annual building activity decreased by 8.2%, dropping by $0.9b to a total of $9.41b. Despite a net increase of three new residential cranes, residential building activity decreased by 2.1% to December 2020. In contrast, non-residential cranes decreased by 2, despite the 18.4% decrease in non-residential work put in place, which fell from $4.0b to $3.3b for the twelve months to December 2020.
Residential cranes continue to dominate Auckland region
The sector grew to 46 long-term cranes and now represent 59% of all long-term cranes across the city. Since the last edition, 16 new cranes were added while 13 cranes were removed.
There has certainly been a residential surge since Q3 2020, in Auckland in particular. The impact of the government’s recent housing policy announcements is uncertain as to whether the strength of the residential construction sector will remain through to 2022.
There has been a rise in the number of long-term cranes seen on the North Shore with four new cranes commencing on sites across the region. Ten sites now dot the region with long-term cranes in Albany, Rosedale, Milford, Wairau Valley, Northcote, and Narrow Neck, up from five previously. Nine of these cranes are in the residential sector.
New long-term cranes were added on significant civil sector projects. These include the City Rail Link at Mt Eden station and the Mangere Bridge replacement.
Queenstown index rises despite hotel and tourism sector
Queenstown’s index continued its rise to a record level of 500, representing 15 cranes. Despite the continued uncertainty in the hotel and tourism sectors, strong residential activity over the past six months has seen residential cranes for apartments, townhouses and large residential dwellings grow to eight cranes from 6 previously.
Building work put in place for the twelve months to December 2020 in the South Island, excluding the Canterbury region, increased by 1.3%, which included a rise in non-residential activity of 7.9% over 2019. South Island (ex-Canterbury) consents rose by 6.0% to $2.6b for the twelve months to December 2020.
Six new long-term cranes commenced within then region, three in the commercial sector, two residential and an additional crane within the Holiday Inn development in Red Oakes Drive.
Wellington reaches record high
Wellington’s RLB Crane Index® continued its upward trajectory with another significant rise of 33 points to reach a record high of 200. This growth was caused by three new long-term cranes being placed in Wellington and no removals for the period. The Wellington construction market and crane index has been impacted the least during 2020.
As identified in our last publication, the construction market in Wellington remains buoyant in the post-COVID environment and appears to be the least impacted centre currently with a strong and reliable pipeline of government related work.
The city’s skyline now showcases 18 long-term cranes, the highest amount since the start of this index.
Christchurch crane activity continues to rise
Christchurch’s crane activity for the Q1 2021 has continued to rise from the record low set in Q3 2019. With a net increase of one crane, Christchurch’s long-term cranes have risen to 15 cranes. This additional crane increased the crane index by three points to 48, up from 45 previously.
The city experienced the addition of six new long-term cranes, while five were removed from projects across the region.
The increase in crane numbers follows a 10% fall in consents recorded for the year ending December 2020. Total consents for Canterbury totalled $3.0b, down from $3.4b in 2019. Work put in place for the year was down 10% in 2020, mainly due to a sharp drop in non-residential work, which fell 20% over 2019 levels.
FURTHER INFORMATION: