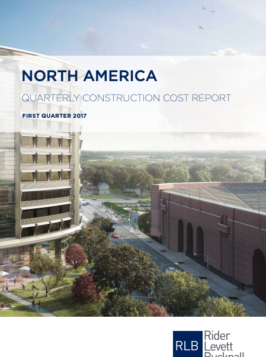
For fifteen years Rider Levett Bucknall (RLB) has published a quarterly construction cost report that has provided its clients with a 360º view of the current state of the industry.
For the recently-published 2017 Q1 report, the firm continues that tradition, and adds new features that enhance its authority and make it more reader-friendly. The improvements in RLB’s North American report include:
- New markets: Toronto and Calgary. The inclusion of these key Canadian cities, where RLB has an established presence, expands the territory covered by the report.
- New tools to visualize data. Color-coded maps and graphs give an immediate picture of the information contained in the report. Readers can quickly hone in on data pertinent to their interests, and interpret it easily, efficiently, and accurately. Comparisons between sectors and markets can be made at a glance, without wading through extraneous statistics.
“Going the extra mile with our quarterly report is one example of the culture of client service we practice at Rider Levett Bucknall,” said Julian Anderson, President of RLB North America. “We’re constantly looking for opportunities to better serve our clients—and the industry—in ways that benefit their projects.”
The U.S. national average increase in construction cost was approximately 5.1%
Our research suggests that between January 1, 2016 and December 31, 2016 the national average increase in construction cost was approximately 5.1%. Los Angeles and San Francisco experienced the greatest annual increases showing escalation over 8% while Boston, Chicago, Denver, New York, Phoenix, Portland, San Seattle and Washington DC experienced more modest annual increases around between 3.3% and 5.0%. Honolulu experienced a significantly lower annual increase below 1.0%.
In Canada, Toronto experienced an increase in construction costs of .57%, while in Calgary they dipped by -1.33%
In Canada, housing starts experienced a 40% increase between Q1 and Q2 in 2016; during the last quarter of the year, they experienced a slight decline of -6.1%. Unemployment for 2016 held steady at 6.9%, in keeping with a five-year average of 7%. The Consumer Price Index remained steady throughout 2016, with a variance of less than 1%. The GDP for construction ranged from -.5% in Q1 2016 to 1.2% in Q4 2016. RLB’s research shows Toronto experienced an increase in construction costs of .57%, while in Calgary they dipped by -1.33%.
FURTHER INFORMATION:


