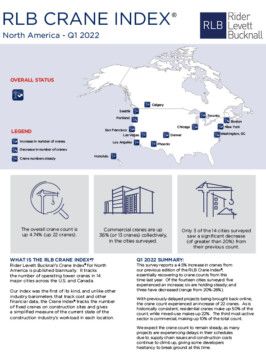
This survey reports a 4.5% increase in cranes , essentially recovering to crane counts from this time last year. Of the fourteen cities surveyed: five experienced an increase; six are holding steady; and three have decreased (range from 20%-26%).
With previously delayed projects being brought back online, the crane count experienced an increase of 22 cranes. As is historically consistent, residential cranes make up 50% of the count, while mixed-use makes up 22%. The third most-active sector is commercial, making up 10% of the total count.
We expect the crane count to remain steady, as many projects are experiencing delays in their schedules due to supply chain issues and construction costs continue to climb up, giving some developers hesitancy to break ground at this time.
A few key highlights:
- Cities seeing an increase in cranes include Chicago, Denver, New York, San Francisco, and Toronto
- Cities holding steady in their crane counts include Honolulu, Las Vegas, Los Angeles, and Phoenix
- Cities with a decrease in cranes include Boston, Calgary, Portland, Seattle, and Washington, D.C.
- The top three sectors for cranes are residential, mixed-use, and commercial
FURTHER INFORMATION: