The Rider Levett Bucknall Q2 2018 RLB Crane Index® released today highlights the relatively stable condition of Australia’s construction industry.
Now in its 12th Australian edition, the bi-annual RLB Crane Index® was created by the firm as a simple indicator of building activity and the general health of our construction markets.
Sunshine Coast now included
Stephen Ballesty, Director of Research & Development at Rider Levett Bucknall (RLB) said, ‘Our latest crane index showcases a relatively steady construction industry. For the first time it also includes cranes on the Sunshine Coast in South East Queensland. Although we see a decrease of only one crane across Australia over the past six months, by excluding the Sunshine Coast’s 10 cranes, the like for like comparison is a fall of 11 cranes across the country, or 1.5%.’
Residential cranes in decline across Australia
According to the RLB Crane Index®, there has been a decline in the number of residential cranes across the country (57 cranes), but this has been offset by a rise in both the commercial and retail sector cranes (21 and 15 respectively).
Melbourne, Newcastle and Hobart record highest crane count on record
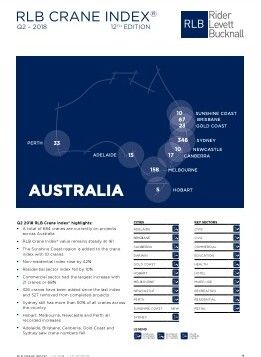
Of the 684 cranes standing tall across Australia, 346 were in Sydney, 158 in Melbourne, 67 across Brisbane, 23 in the Gold Coast, 33 in Perth, 17 in Canberra, 15 in Adelaide, 10 in Newcastle, 10 in the Sunshine Coast, 5 in Hobart, with 0 in Darwin.
The current crane count was the highest on record for the cities of Melbourne, Newcastle and Hobart, but Adelaide and Sydney fell from their respective peaks in the previous edition.
Sydney records first fall since start of index
Stephen continued, ‘The impact of the slowing mining sector and the large number of residential apartment completions within Brisbane has seen a 21% fall in crane numbers. Although residential cranes fell within Sydney with 45 removals, the non-residential sector grew, offsetting these losses. A net loss of four cranes within Sydney is the first fall since the commencement of the index.’
Residential still dominates in Sydney
The residential sector accounted for 73% of all cranes installed in Sydney, and represented 51% to total residential cranes erected within Australia. The 253 residential cranes in 103 suburbs across Sydney were counted, representing a reduction of 45 cranes. However, Sydney’s total crane count of 346 is only 4 cranes down on our last edition, signalling a rise in activity of other market sectors.
Melbourne project tops residential crane count
Since our last index there has been a movement of cranes across Melbourne. CBD increases were mainly driven by new large projects such as 311 Spencer Street (Vicpol), 447 Collins Street, Atira student living and Eastbourne apartments which contributed 11 cranes to the city skyline since our last publication. Mason SQ in Moonee Ponds currently has seven- the most residential cranes of any site within Australia.
Apartment surge impacts Brisbane
Brisbane’s recent residential apartment surge has impacted crane numbers across the city. With overall crane numbers falling below 2015 levels, current building approval values are still strong with the last three calendar years recording similar levels at $20.3 billion for Queensland.
Stephen concluded, ‘Taking into account that the high apartment approval levels of 2015 were a catalyst for the rise in crane numbers from 2016 to early 2017, it seems that the large growth in development over the past two years has been largely completed. We foresee a more stable level of development for the next period to come.’
FURTHER INFORMATION:


