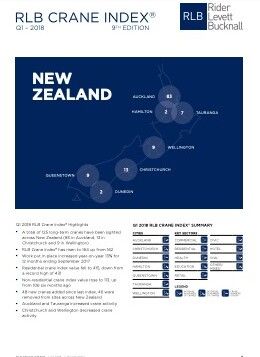
According to the Rider Levett Bucknall Q1 2018 RLB Crane Index® New Zealand’s national crane count has increased to 125 cranes across the country, and construction growth is forecast to continue.
The ninth edition (Q1 2018) of the RLB Crane Index® highlights the continuing growth in building work put in place across New Zealand. It grew by 13% over 12 months to September 2017, totalling just under $17 billion. The hotel and education sectors had the largest increases, with 48% and 22% respectively.
Auckland dominates the skies
Chris Haines, Director of RLB in Auckland said, ‘Auckland continues to dominate New Zealand skies with 83 cranes in place accounting for 66% of all cranes counted across New Zealand main centres. 33 new cranes have been erected in the Auckland area, and 23 removed from projects that are nearing completion.’
Decreases in Christchurch and Wellington
Auckland’s crane count increase was driven by net increases in the hotel and civil sectors of four cranes each, the commercial and civic sectors of two cranes and the mixed use sector of one crane. Tauranga also had a net increase in cranes of three. Christchurch and Wellington saw net decreases in cranes of four, bringing their total counts to 13 and 9 respectively. While Hamilton and Queenstown also experienced net crane decreases of 1 and 2 respectively.
Residential sector the main driver
According to the RLB Crane Index® Auckland remained the main driver of the crane count, increasing by ten cranes since the last index. The residential sector continued to contribute the largest amount of the crane count, with 48 (57%), but recorded a slight net decrease of two cranes for the period.
Apartment projects the busiest
Auckland’s busy residential sector cranes on apartments accounted for 89% of all the residential project cranes across New Zealand and 38% of all cranes nationally.
Additional new long-term cranes were observed on the following projects around Auckland:
Waiparuru Hall at the University of Auckland, Crest Apartments Grey Lynn, Ted Manson’s Foundation Glen Eden Apartments, Lynfield Residential, Lakewood Plaza Manukau apartments, Library 27 apartments, The International, Mills Lane, Auckland Museum, City Rail Link, 4 Points Sheraton Hotel, Ryman Browns Bay Aged Care Apartments, ONE55 office, Wynyard Common Pump Station, Les Mills Carpark Building, Maritime Apartments, Mount Eden Prison, Sylvia Park Carpark, Industrial buildings at Wiri and Three Kings apartments.
Chris continued, ‘The civil and hotel sectors saw the addition of four cranes each while the commercial and civic sectors added two cranes each and mixed use erected one. The education sector was the only other sector besides residential to have a slight fall in new cranes, with one removed.’
New building consents increasing
The number of new building consents in New Zealand have been steadily increasing since 2012, with an average growth year-on-year of 10%.
‘The largest contributor is Fletcher Construction which currently has 10 tower cranes. This is despite their announcement last month that they are pulling out of the Building and Interiors sector. The impact of this exit will be interesting over the next 18 months and we expect to see increased moves from both the Australian and Chinese construction sectors’ he added.
Government policies to impact construction sector
Chris concluded, ‘It will be interesting to see how the new government policies under Jacinda Ardern’s leadership will impact the buoyant construction sector. They are reducing overseas purchasers’ rights and increasing residential investment tax policy, which may put the brakes on forward investment. But there may be a positive impact from policies such as Kiwibuild.’
RLB believes current forward workload in infrastructure, health, hotels and residential will remain particularly strong with a solid pipeline of construction activity for years to come.
FURTHER INFORMATION: