According to today’s release of the Q1 2023 RLB Crane Index®, crane numbers across the country have peaked.
Mr Domenic Schiafone, RLB’s Oceania Director of Research and Development said, “Whilst the 835 crane numbers across the country continue to be strong, posting the second highest number of cranes seen since the inception of the RLB Crane Index® in 2012, this represents a 3.8% fall from the record 868 cranes seen in the last edition.”
“The past six months has seen 292 new cranes added to new development sites, and 300 were removed from projects nearing completion, resulting in 33 less cranes. The continuing strong number of cranes observed correlates with the strong national activity numbers,” he added.
Growth in total building approvals
Construction work done for the calendar year 2022 was up by 0.7%, or $1.4B, across Australia compared to 2021, according to the latest ABS preliminary construction activity data. Total residential work done was down 3.5%, or $2.7B, non-residential activity was up by 2.9% or $1.4B. Engineering activity was up by 2.9% or $2.5B.
Growth in building approval values continued in the calendar year 2022 where total building approvals rose by 1.0% or $1.3 in real terms. Residential approvals fell 2.2% and non-residential rose 5.3%.
The Q1 2023 RLB Crane Index® found national crane numbers fell in the past six months with all sectors except civic, civil and education. The residential index recorded an index level of 171, fractionally below the peak of 172 recorded in Q3 22 and Q1 19.
Large fall in crane numbers in Melbourne CBD
Mr Schiafone continued, “The non-residential index fell from its record high of 290 to 264 for this edition. When analysing the numbers of cranes centred around the key capital cities post COVID-19, cranes within the CBD of Melbourne (Hoddle Grid, Docklands and Southbank) have fallen significantly. In the Q3 19 edition, cranes numbered 68. Since then, the region’s cranes have fallen in the next seven editions to now number only 26 cranes. In comparison, cranes in Sydney and Barangaroo have risen from 29 to 30.”
Sydney still the main driver of crane count
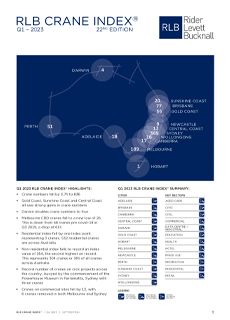
Looking around the country, Sydney continues to be the main driver of the crane count. Of the 836 cranes sighted across Australia, 365 were in Sydney, 189 were in Melbourne, 77 were in Brisbane, 56 on the Gold Coast, 51 were in Perth, 20 in the Sunshine Coast, 18 in Adelaide, 17 in Canberra, 16 in Wollongong, 13 in the Central Coast, 9 in Newcastle, 4 in Darwin and one crane in Hobart.
According to RLB, as all major cities across the globe grapple with the realities of changing lifestyle and hybrid employment choices, development within the centre of Melbourne has fallen to decade lows according to crane numbers observed. Whereas other capital cities, except for Adelaide which has a similar profile to Melbourne, have seen relatively stable crane numbers across their preeminent districts.
Mr Schiafone concluded, “The continuous reduction in crane numbers within Melbourne’s CBD district may be a contributing factor of the decrease of public transport patronage within Melbourne. According to the latest figures released by the Victorian Department of Transportation and Planning for September 2022, patronage of public transport within inner Melbourne (including the city loop) has fallen to 37% of pre pandemic levels.”
Pressure on retail, hospitality and commercial to get to pre-pandemic activity
“With less development being undertaken across the district, less construction and associated workers are frequenting the hospitality, retail and other services available within the CBD. Coupled with low office occupancy levels for February 2023 that are still below 50% within the CBD of Melbourne, according to the Property Council of Australia’s last survey, pressure is on retail, hospitality and commercial businesses to rebound to pre pandemic levels of activity. Lower levels of crane activity highlighting lower levels of construction activity within the CBD, may be contributing to the lengthening reawakening of the district,” he said.
The Q1 2023 RLB Crane Index® found the non-residential index has fallen from the record highs of the last edition to now recording an index value of 264, the second highest on record, representing a loss of 5.7% or 29 cranes. Included within the non-residential sectors are Aged Care and Data centre / Industrial introduced in the last edition. There are currently 11 cranes on Aged-Care developments across the country and 15 Data Centre / Industrial cranes. Residential cranes across the country now number 532, slightly below the numbers recorded in our last count.
Crane numbers decrease in Sydney, but still remain second highest on record
One hundred and ninety-six cranes were added on development sites with 199 removed. Perth saw an additional nine cranes added within the sector whereas Sydney saw numbers reduce by 13. Both Sydney and Melbourne’s crane numbers fell by 15 and 17 cranes respectively but still count for 66% of all cranes sighted. Both the Gold Coast and Sunshine Coast recorded gains with an additional 4 cranes in each of these regions.
In this edition, Sydney receded from its 235 point peak in the previous edition to currently sit at 225 index points, reflecting a 4% decrease. This decrease represents a net loss of 15 cranes across Sydney. Over the past six months, a total of 114 cranes have been removed, whilst only 99 new cranes were erected. However, in retrospect, the current index figure is still the second highest recorded, with the city still maintaining 365 cranes in the skies.
South East Queensland reaches a new high
Brisbane recorded a fall in this edition as the RLB Crane Index® value fell from 112 index points recorded in Q3 2022, to 105 points currently, wiping out gains recorded in the previous edition. This represents a total of 77 across Brisbane with 40 cranes removed from sites and 35 cranes added. While Brisbane has recorded a net loss in crane numbers, the Sunshine Coast and Gold Coast have performed stronger, bringing the total number of cranes across South East Queensland to a new high of 153 cranes. This increase, however, came at a cost to the civil and mixed-use sectors which saw net decreases of 6 and 2 cranes respectively, while education gained seven new cranes with all other sectors remaining at least level, or seeing moderate gains.
FURTHER INFORMATION: