According to today’s release of the Q1 2023 RLB Crane Index®, a record 157 long-term cranes were sighted on construction sites nationally in March across the main centres, with resilience being shown by most sectors.
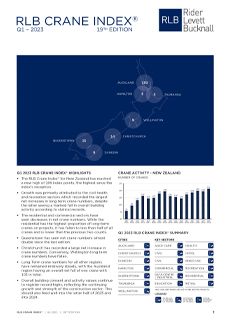
The report found that New Zealand has 157 long-term cranes on construction sites across the seven main centres. 103 cranes in Auckland, 9 in Wellington, 14 in Christchurch, 15 in Queenstown, 5 in Tauranga, 6 in Dunedin and 5 in Hamilton.
Rider Levett Bucknall Director Mr Chris Haines said, “Today’s release of our RLB Crane Index® shows another strong result for NZ’s construction industry. Resilience is continuing to be shown with significant activity across most sectors.”
Small decrease in residential cranes
“There has been a slight dip in the residential count, which we expect to become more pronounced in future counts due to financial lending constraints and residential market conditions. Infrastructure repairs from Cyclone Gabrielle may also influence long term crane numbers in the future. RLB expects continued capacity pressure in the civil sector across the upper North Island,” he added.
New Zealand’s construction industry has continued its growth in overall activity, with the total value of building work put in place over the calendar year 2022 crossing the $30B mark for the first time to total $34.4B, up 20% over 2021. The residential sector had a strong increase in building activity through 2022, with work put in place increasing by 21% to $23.4B.
Work volume high despite labour and supply chain issues
The non-residential sector recorded a 20% increase in total work done compared to the year prior, $10.9B compared to $9.1B. However, some sectors are performing significantly better than others; for example, Health, Industrial, and Commercial sectors are vastly outperforming Hotels and Social Building sectors. Overall, the rate of growth across the industry indicates that work remains in high volume, despite productivity impacts such as availability of labour and supply chain issues experienced over the last two years.
Mr Haines continued, “The pipeline of construction work has continued to remain healthy. Building consents over calendar 2022 totalled $32.2B, 9% higher than the
$29.6B recorded for 2021 which was the decade peak. However, with the cost of finance increasing and valuations moving certain sectors are being more affected than others.”
“Total residential consent approvals grew by 7.0% in calendar 2022 to $22.7B; this growth is half the rate of total non-residential consents which grew by 13.1% to $9.5B. How many of these consented residential projects become live construction projects remains uncertain.”
Building consents continue to grow
“It should be noted that like building activity, building consents in the total non-residential sector varies; offices, health, and industrial sectors have seen consent values continue to grow, while the hotel and retail sectors have seen little, if any growth. The current trends in consent values are likely to be a strong indicator to future crane activity over the next 12 to 18 months,” he said.
With the overall value of building activity and consents at record highs, New Zealand’s RLB Crane Index ̈ figure has reached a new high of 199 index points, and currently sits at the highest level recorded.
There was a net increase of 9 long-term cranes for this edition, with a record high of 157 cranes on development sites across the main centres of New Zealand. 63 cranes were removed from sites, while a total of 72 new long-term cranes were placed on site. The increase in net crane numbers is primarily attributed to the civil sector, recording an extra six net cranes, although the health and recreation sectors also recorded moderate growth of three cranes each.
Residential crane numbers fall slightly
New Zealand’s residential crane index value has decreased slightly to 323 index points, down from the 345-point peak recorded in the previous edition. The present figure represents 71 long-term cranes, down from 76 cranes previously. Residential cranes now make up 45% all cranes in New Zealand (previously count was over 50% of the total).
The quiet retail sector has finally seen a new crane as part of the retail spaces on 120 Manchester Street in the Christchurch CBD.
Crane numbers almost double in Queenstown
Mr Haines continued, “Within the regional centres, Queenstown has seen the most notable difference, with crane numbers almost doubling from 8 to 15 cranes over the past year and a strong residential market that is bucking the trend. Christchurch recorded an increase of a net 4 cranes. Wellington recorded the largest net decrease in cranes, dropping from 12 cranes to 9. Auckland saw 38 new cranes and 39 cranes removed, for a net decrease of one crane, with 103 in total.”
“The government’s budget announcement in May is eagerly awaited, which will have significant implications for the Health, Education, Housing and Civil Infrastructure sectors in particular. We are expecting some winners and some losers, and particularly given the infrastructure repair and resilience work on the back of Cyclone Gabrielle and with the City Rail Link announcement in March of a $1.074B cost increase and 12 month delay,” he said.
Auckland’s RLB Crane Index® figure has once again moderated slightly compared to the previous edition, sitting at 312 index points (compared to 315 previously). This figure represents a total of 103 long-term cranes, a net loss of one crane compared to Q3 2022.
The value of building work done increases
While there has been little net change in crane numbers across Auckland, the number of cranes taken down and cranes erected are significantly higher than the previous edition. The region sees a total of 39 cranes removed, while a total of 38 cranes being put up (compared to only 17 new cranes in the previous edition).
Tower cranes have increased to three at Auckland Airport who recently announced a $3.9B spend over the next 5 to 6 years.
Despite the overall number of cranes in Auckland remaining steady, the value of building work done in the region over CY 2022 has increased by a significant margin; the year saw $13.6B worth of work done, a 24% increase on 2021 figure, and currently sits at a decade peak. This high annual figure is reflective of building activity increases in both the residential and non-residential sectors which increased by 22% and 27% respectively.
Crane activity picks up in Auckland’s east and south-eastern areas
Residential cranes continue to remain primarily in the suburbs, although now account for a slightly lower proportion of cranes overall at a 54% share (down from 57%). New residential sector cranes have been erected in the Epsom, Grey Lynn, Hobsonville, My Eden, New Lynn, Northcote, Onehunga, Orakei, Parnell, Point England, Ponsonby, Remuera, and Takapuna suburbs. Crane activity has picked up significantly in Auckland’s east and south-eastern areas, with many new residential cranes erected. Conversely, activity has gone down noticeably in the Upper North Shore area, with projects around the Browns Bay and Albany areas nearing completion. A significant number of projects that host cranes have shifted downwards towards the Northcote and Takapuna areas.
FURTHER INFORMATION: