According to today’s release of the Q3 2020 RLB Crane Index®, there are currently 677 cranes working on key projects across Australia, a 6% decrease in crane numbers recorded since the outbreak of COVID-19.
Domenic Schiafone, Rider Levett Bucknall’s Oceania Director of Research and Development said, ‘The uncertainties surrounding the COVID-19 pandemic have not impacted the Australian construction industry as we had expected.’
Construction industry fortunate to be deemed an essential service
‘While most industries nationwide have had to grapple with the effects of lockdown, the construction industry to date has not experienced a complete and sudden halt. We’ve been very fortunate that construction was deemed an essential service by both State and Federal Governments, which allowed sites to stay open and operating all year,’ he added.
Crane numbers across all sectors fell by 45 or 6.2% recording a total of 677, down from 722 in Q1 2020. This is only slightly more than the 4.6% drop in total cranes numbers recorded between Q3 2019 and Q1 2020, and a 10.6% drop from the peak numbers of 757 in Q3 2019 to now.
Activity falls but not as anticipated
Domenic continued, ‘We are not seeing the huge drop in numbers across the country we were anticipating. Melbourne, Brisbane and the residential sector are the major contributors to the reduction in crane numbers. Melbourne’s crane numbers decreased by net 17 and Brisbane’s crane numbers decreased by net 8. The residential sector fell by 38 cranes.’
While activity has fallen 4.6% ($9.6b) for FY 2020 over the previous twelve months, the significant portion of the fall (88%) has come from the residential sector.
This correlates with the fall in crane numbers where the residential crane index fell to 145, the lowest since Q2 2018. Overall, residential crane numbers across the country fell by a total of 38 for this edition.
Recent data released by the ABS indicates that approval levels for the seven months of 2020 are slightly down ($0.6b) on the same period in 2019.
Health sector records 66% increase
According to the RLB non-residential index, a small decline was recorded to 197 from 203 in Q1 2020, representing a drop in crane numbers of seven. The Health sector contributed to the small net reduction by adding 12 cranes across the country. In fact, this made the health sector the standout performer, with a surge of 66% increase.
Since our last edition, 272 cranes were added to our skylines and 317 removed, representing a churn rate of 0.86, the lowest rate since Q1 2017.
Melbourne the major contributor to drop in crane numbers
Melbourne, which is enduring the longest and strictest lockdown amongst the capitals, is the major contributor to the drop in crane numbers with a 17 net drop in numbers, while countercyclical to Melbourne’s drop was Sydney where a net 2 cranes were removed from development sites.
As an RLB Crane Index first, due to Melbourne’s second lockdown from early August 2020, crane data was collected by using up-to-date high resolution aerial imagery for locating cranes on projects, together with RLB staff observations within their local 5 km radius restriction zones.
Contractors in Melbourne on the front foot before Stage 4 lockdown
Domenic, who is based in Melbourne, commented specifically on the Melbourne market. He noted, ‘Prior to the Stage 4 lockdown, on-site works were generally unaffected. Contractors were diligent in quickly putting COVID-19 safety plans in place, alternative work / shift hours to limit resources on site and maintaining social distancing. There were minor supply chain challenges, however, contractors were again on the front foot and in a general sense, delays were mitigated.’
The landscape changes for many projects
Domenic also said that since stage 4 restrictions came into play with the 25% workforce capacity, the landscape has changed for many projects and, as expected, productivity on site has fallen. While most sites have continued to operate through Stage 4, others have frozen or stopped work given the limit to resources is not viable and they are better off to sit the lockdown out. The extent of what this means from a cost / programme perspective is not exactly known at this stage, however as restrictions are eased over the next month we will get a clearer indication given we expect to see claims coming through the system.
The economic impact of COVID-19 to hit hardest in early 2021
‘At the other end of cycle, enquiries for new projects have been somewhat surprising. While activity is down, it hasn’t come to a complete halt and is better than first anticipated back in March when the pandemic hit. Contractors have also reported they have been quite active from a tendering perspective and similarly, perhaps more so than anticipated. We are seeing some competitive tender results, which is great for developers, owner’s, etc. and will help in keeping projects viable. Uncertainty is still prevalent, and we see testing times ahead. We anticipate the economic impacts of COVID-19, both federally and state, will be felt hardest in early 2021.’
The Gold Coast and Sunshine Coast standout performers with increasing crane numbers
According to the RLB Crane Index, since Q1 2020, 272 new cranes were erected across the country. Over the same period in 2019, 416 new cranes were placed on sites. The Gold Coast and Sunshine Coast were the standouts where crane numbers increased from 33 to 34 (Gold Coast) and from 11 to 15 (Sunshine Coast).
Canberra, Gold Coast, Perth and Sydney all showed resilience with similar crane numbers from previous.
Sydney the main driver of the crane count
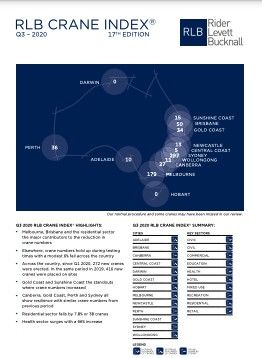
Looking around the country, Sydney continues to be the main driver of the crane count. Of the 677 cranes sighted across Australia, 297 were in Sydney, 179 were in Melbourne, 50 were in Brisbane, 36 were in Perth, 34 were on the Gold Coast, 27 were in Canberra, 10 in Adelaide, 11 in Wollongong, 15 in the Sunshine Coast, 13 were in Newcastle, 0 were in Hobart and 0 in Darwin.
Across Sydney’s five main regions, all regions, except for the west, experienced a decrease in crane numbers. The fall of five cranes in the north was the largest decrease. Western Sydney, in comparison, recorded an increase of eight cranes.
FURTHER INFORMATION: