According to the latest RLB Crane Index®, there are currently 72 cranes on Brisbane’s skyline. Commencing from a base of 67 cranes six months ago, 42 cranes were dismantled on sites while 47 new cranes were erected.
David Stewart, Managing Director of RLB in Queensland said, ‘This increase in crane numbers was reflected in the rise in construction work done for FY 2018. Work done in Queensland increased 2.6% in FY 2018. The engineering and non-residential construction sectors were the main drivers, up 8.8% and 7.6% respectively.’
Residential sector dominates
‘Offsetting these increases, the residential sector saw a decline of 8.2%. Within Brisbane, the residential sector continued to be the most dominant sector, with 45 cranes. The mixed-use sector had the greatest increase in crane numbers with 13 new cranes,’ he added.
This increase coincided with the commencement of the Howard Smith Wharves development (four cranes), Queens Wharf (three), Portside Wharf in Hamilton, and 949 Ann Street, in the Valley (two each) and Lincoln Street, Stones Corner with one crane.
According to RLB, a total of 29 cranes commenced on residential projects. These developments include: Elizabeth Arcade Student Accommodation, The Boatyard in Bulimba, Omega and Coterie in the Valley, Lume in Kangaroo Valley, Icon in Milton, Lucent Gasworks in Newstead, White Dawn in Toowong, Saccharo in St Lucia, Citro in West End, Vista in Indooroopily and Ivie in Greenslopes.
Decline within civil sector
Twenty seven cranes were removed from residential sites across the city since our last edition. Brisbane saw a decline of six cranes within the civil sector.
Seven cranes were removed from the $650 million Kingsford Smith Drive widening project, offset by one crane erected at King George Square in Ann Street. Small crane increases were seen in the commercial and recreation sectors and the health sector remained constant at two cranes. In contrast, the education and hotel sectors saw declines of one and three cranes respectively.
Large projects increase cranes in CBD
David continued, ‘Across Brisbane, there appears to have been a movement of cranes from the North and South towards the CBD. CBD increases were mainly driven by new large projects such as, Howard Smith Wharves and Queens Wharf, which contributed an additional seven cranes to the city skyline.’
In the east, two new cranes were associated with a mixed-use project in Stones Corner and a residential project on Logan Road, Greenslopes.
The decrease in the north, was mainly driven by the removal of all seven cranes for the Kingsford Smith Drive Upgrade. Completed residential projects saw crane numbers fall in the south. The west had minimal changes in crane numbers, indicating continuing activity.
Sydney continues to lead crane count
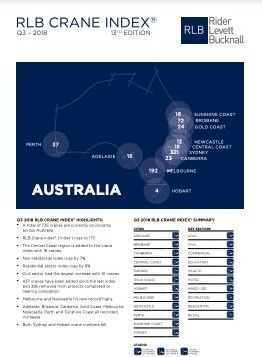
The RLB Crane Index® found that Sydney continues to be the main driver of the crane count. Of the 735 cranes sighted across Australia, 321 were in Sydney, 192 were in Melbourne, 72 were in Brisbane, 37 were in Perth, 24 were on the Gold Coast, 23 were in Canberra, 16 were in both Adelaide and the Sunshine Coast, 12 were in Newcastle and 4 were in Hobart.
FURTHER INFORMATION: