According to the Q3 2021 RLB Crane Index®, there are currently 718 cranes working on key projects across Australia, an increase of 27 cranes since the previous edition.
Mr Domenic Schiafone, Rider Levett Bucknall’s Oceania Director of Research and Development said, “These past six months has seen the country slowly accelerate towards a post Covid ‘new normal’. Even with differing levels of lockdowns and business closures across the Commonwealth, most regions, except for Melbourne and the Sunshine Coast, saw crane numbers increase.”
Construction industry operating at two speeds
“The federal government’s stimulus measures have assisted the economy but the impact on residential construction continues to see the industry operate at two speeds. Residential housing, assisted by both federal and state incentives, appears to be travelling at breakneck speed and does not appear to have suffered from any COVID-19 hangover at this stage.”
The residential sector has seen a large increase of 23 crane numbers in this edition.
Government sponsored civil projects continue to expand across the nation while health and recreation projects have grown over the past six months.
Tourism, retail and commercial sector hardest hit
According to the RLB report, multi-storey residential developments have recovered from their fourth consecutive fall in the last edition, mirroring the rise in building approvals and work done in this subsector during FY 2021. The industries hit hardest by the lockdowns in 2020 and 2021, namely tourism, retail and commercial, all recorded falls in crane numbers.
Construction work done for FY 2021 was down 0.6% across Australia representing $1.3B. Total residential work done was up 2.1% or $1.5B. Non-residential activity was down by 5.4% or $2.7B while engineering activity was down by 0.2% or $191M.
Approval levels show strong growth since 2019
Strong growth in approval levels through FY 2021 saw a 15% lift in the total value of approvals across the nation. Multi-level apartments (+6%), houses (+40%), health (+12%), all contributed to this increase from the lows in FY 2019 and 2020.
Crane numbers across all sectors rose by 27 or 3.9% reaching 718, up from 691 in Q1 2021. The RLB Crane Index®, which peaked in Q3 2019 at 178, is currently 169.
The civil sector saw the biggest rise with an additional 10 cranes. The civic (1), health (9), mixed use / other (3) and recreation (2) sectors all recorded increases in crane numbers. Residential cranes rose by 23 cranes or 5.5% to now number 441 or 61.4% of all cranes around the country.
Brisbane records biggest increase in cranes
Since our last edition, 329 cranes were added to our skylines and 302 removed.
Mr Schiafone continued, “Brisbane again recorded the biggest increase in crane numbers of 12 to now total 83 cranes. Queen’s Wharf in Brisbane is the project with the greatest number of cranes in Australia (nine).”
“Melbourne, which continues to endure the longest and strictest lockdown of all cities across the globe, fell by 13 cranes. Sydney (9), Perth (7) and Canberra (7) all recorded strong increases,” he added.
Sydney still the main driver of crane count
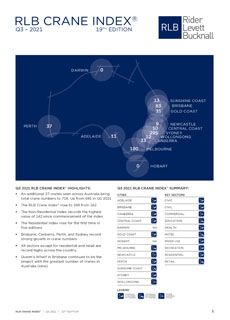
Looking around the country, Sydney continues to be the main driver of the crane count. Of the 718 cranes sighted across Australia, 295 were in Sydney, 180 in Melbourne, 83 in Brisbane, 37 in Perth, 35 on the Gold Coast, 33 in Canberra, 11 in Adelaide, 12 in Wollongong, 13 on the Sunshine Coast, 9 in Newcastle, 0 in Hobart and 0 were in Darwin.
Across Sydney’s five main regions, decreases were seen in the north and south with increases in the inner city and west regions. The increase of 13 cranes in the west has resulted in the region now home to more than 25% of all cranes across the city.
North Sydney saw the largest decrease of cranes, with a decrease in 7 cranes.
Across Melbourne’s six main regions, small crane increases were seen in the east and the west. Falls were seen in Inner Melbourne, north, south and the Geelong region. Inner Melbourne saw the largest fall of 10 cranes.
FURTHER INFORMATION: