According to today’s release of the Q3 2022 RLB Crane Index®, crane numbers across the country rose sharply in the past six months; 300 new cranes were added on developments sites, and 245 were removed.
With the additional 55 cranes, there is now a total of 868 cranes in operation nationally, a new high in the RLB Crane Index® since its inception in 2012.
This edition of the Index includes the introduction of two new sectors within the non-residential market; cranes on aged care and data centre / industrial developments have been given their own sector to reflect the growing importance and numbers of these projects.
Inclement weather, material and labour shortages still an issue
Domenic Schiafone, Rider Levett Bucknall’s Oceania Director of Research and Development said, “Whilst this strong number shows the continuing resilience of our industry, projects are also being delayed due to increases in inclement weather events, shortages of materials, and lack of skilled labour.”
He added, “If cranes providing logistical assistance to multi storey developments remain on site longer than anticipated due to weather events and supply chain disruptions, the cost of preliminaries increase, causing overall costs to rise.”
The strong growth in crane numbers for Q3 2022 appears to correlate with the strong national activity numbers. Upon investigation, the churn rate of cranes around Australia has fallen significantly over the past 18 months. From Q1 2019 until Q1 2021, the churn rate hovered around the 50% mark. Since Q1 2021 the churn rate has dropped nationally to reach 28% in Q3 2022.
Introducing the RLB Crane Index® churn rate
New in this edition, the RLB Crane Index® churn rate is calculated as the number of cranes removed in a period, divided by the closing number of cranes, and expressed as a percentage.
A lower crane churn rate percentage is an indicator that cranes are remaining on sites longer. Canberra has the highest churn rate for this edition at 70%, whereas Sydney recorded a 27% churn rate. This changing churn rate factor is aligned with recent media reports that projects are delayed due to increases in inclement weather events, shortages of materials, and lack of skilled labour.
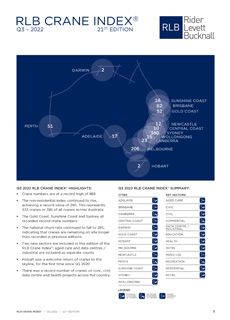
Looking around the country, Sydney continues to be the main driver of the crane count. Of the 868 cranes sighted across Australia, 380 were in Sydney, 206 were in Melbourne, 82 were in Brisbane, 51 were in Perth, 55 on the Gold Coast, 23 in Canberra, 17 in Adelaide, 16 in the Sunshine Coast, 15 in Wollongong, 12 in Newcastle, 10 in the Central Coast and two cranes in both Hobart and Darwin.
Strong crane growth in all sectors except commercial and recreation
According to the latest ABS data, construction work done for the 2022 financial year was up by 1.1% (or $2.4B) across Australia compared to 2021 results. Total residential work done was down 0.1% (or $1B) non-residential activity was up by 2.3% (or $1.1B). Engineering activity was up by 1.6% (or $1.4B).
Growth in approval values was seen in the 2022 financial year, with total building approvals rising by 4.2%, or $5B in real terms. Residential approvals lifted 2.6% and non-residential 6.3%. Recent July 2022 approval numbers are trending downwards, which may impact future crane numbers.
Strong national crane growth has been seen in almost all sectors except commercial and recreation, which both fell. The residential index rose to its highest level since Q1 2019, and the non-residential index continued its upward trajectory to reach its highest value in the past 21 editions of the index.
New sectors included in non-residential crane count
The non-residential index has again increased to a record level, rising to 290 points from 268 in Q1 2022. This 7.4% increase represents an additional 25 cranes. Included within the non-residential sectors for the first time are the new sectors of aged care and data centre / industrial. There are 14 cranes on aged care developments across the country and 21 on data centre / industrial developments. In previous editions these new sectors were counted within the residential and mother/mixed use sectors. Crane numbers for Q1 2022 have been retrospectively adjusted for these new sectors for comparison purposes.
Domenic continued, “Australia’s crane capital, Sydney, increased crane numbers by another 32 to total 380 cranes. This represents 44% of all cranes across the country. The Gold Coast and Melbourne recorded double figure lifts in crane numbers of 14 and 12 respectively. Both Canberra and Perth recorded crane reductions of eight and four respectively.
Sydney records its highest ever result
Sydney’s Q3 2022 RLB Crane Index® recorded its highest ever result in the 21st edition. The index rose from 215 points to 235, a 9% increase. The increase represents a net increase of 32 cranes across Sydney. During the past six months there have been 93 cranes removed and 125 new additions resulting in a total of 380 cranes, up from 348 previously.
In this edition, Sydney recorded significant crane number increases in the residential, civic and data centres/industrial sectors. Small increases were recorded in the aged care, civil, education and mixed-use sectors, while the health, hotel and retail sectors remained static. There was a small drop in recreation projects.
The residential sector jumped this count to record 79 additions and the removal of 63, bringing the total count to 259 cranes across Sydney. Residential cranes make up almost 70% of all cranes across Sydney.
Most Melbourne cranes centred around CBD
According to the RLB Crane Index®, there were 79 cranes added to projects across Melbourne and 65 were removed. This brings the current crane number to 206, up from 192 cranes recorded in Q1 2022.
Melbourne’s inner-city remains the most prevalent region for cranes with 46% of all Melbourne’s cranes. This number is close to the last edition, but the trend is still that larger scale projects are moving out to the suburbs. Traditionally, we have seen around 60% of all Melbourne’s cranes centred around the CBD and surrounding inner city suburbs.
Overall, the rise in cranes occurred in the residential sector (+5), data centres/industrial (+4), retail (+4), commercial (+3), health (+2), recreation (+2) and civic (+1). Falls were seen in the mixed-use sector (-5), aged care (-1) and within education projects (-1). The hotel sector remained constant.
The residential sector is still the dominant sector in the Melbourne region, accounting for almost 50% of all cranes for this edition.
Residential dominates on Gold Coast
On the Gold Coast, a total of 21 cranes was added and nine cranes were removed, bringing the coast’s total to 52. The residential sector continues to dominate the region, accounting for more than 95% of all cranes on the Gold Coast. The other sectors with active cranes include aged care (1), commercial (1) and mixed use (1).
The residential sector saw 20 new cranes placed on sites and eight removed, bringing the sector’s total to 48 cranes. This is an increase of 12 cranes from the Q1 2022 edition of the index.
FURTHER INFORMATION: