Rider Levett Bucknall’s Q4 2017 RLB Crane Index® released today highlights that residential cranes still dominate the skies across New Zealand, with 56 cranes representing 45% of all cranes commissioned on private residential, student housing and aged-care housing projects. The sector saw a net gain in crane numbers of seven. Residential now represents almost 70% of Auckland cranes.
RLB introduces residential index
Due to the importance of this sector, RLB has introduced a separate residential index based on cranes only on residential projects. Currently the residential crane index stands at 431, up from 377 in Q2 2017. The rise in this index represents the sixth continuous increase in residential cranes across the country.
Commercial projects underway account for 27 cranes, down from 34 at the last count. This sector accounts for 27% of all cranes in New Zealand. Both the health and hotel sectors saw net falls across the country of three and four cranes respectively. Civil projects nearing completion saw the sector fall by four cranes to nine.
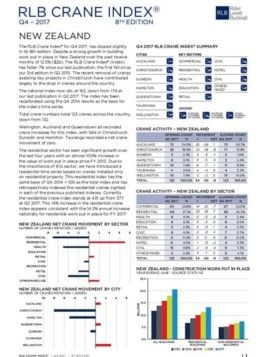
Mr Chris Haines, Director at Rider Levett Bucknall (RLB) said, ‘Our latest RLB Crane Index® shows 123 cranes across New Zealand, down from 132. Activity is most buoyant in Auckland with 73 active cranes and Christchurch having 17 cranes. These markets are followed by Wellington (13 cranes), Queenstown (11), Tauranga (4), Hamilton (3) and Dunedin (2).’
Crane numbers drop in Christchurch, Dunedin and Hamilton
‘The removal of long-term working cranes on key projects in Christchurch and Auckland has contributed to this overall drop in crane numbers. Sixty-three long-term cranes were removed from sites across the country over the past six months, offset by 54 new working cranes, highlighting continued strong levels of construction activity,’ he added.
Wellington, Auckland and Queenstown all recorded slight increases in the index, with falls in Christchurch, Dunedin and Hamilton. Tauranga recorded a net crane movement of zero.
Mr Haines continued, ‘It is now more than six years since the earthquakes hit Christchurch. Since our last publication, 18 cranes have been removed from many significant rebuilds within Christchurch which has seen the index fall to 55, the lowest index value since it commenced. The index represents 17 cranes, the lowest count since a high of 31 in Q4 2015.’
Auckland outnumbers Christchurch as community projects end
As recently as Q4 2014, Christchurch had more long-term cranes than Auckland, but Auckland now out numbers Christchurch by over 4 cranes to 1.
The fall in crane numbers coincides with the completion of important community projects around Christchurch. These include the Christchurch Justice and Emergency Services Precinct, Crowne Plaza, Forte Health Expansion, Hereford St Carpark, King Edward Barracks, Lichfield Street Carpark Building, The Crossing and The Terrace. Three cranes have been removed from the Acute Services Building at the Christchurch Hospital, which is due to open in 2018.
Eighteen cranes have been removed since our last index, with ten new cranes on new developments. These include a new retail & office development in Colombo Street, retail in Manchester Street, Atlas Quarter, Hoyts Entx development, commercial projects in St Asaph Street and in Armagh Street, Archibald’s new building and Strata Love in High Street.
Auckland continues strong economic growth and housing activity
According to Mr Haines, Auckland continues to see strong economic growth driven by high inward migration, increasing tourist numbers, as well as solid housing activity, manufacturing and consumer spending. Current demand is continuing to put pressure on the current supply and the viability of some projects remains under pressure.
He added, ‘Given this already busy sector, it will be interesting to see where the finance, capacity and supply chain growth will come from to achieve the 10,000 homes a year the new coalition government has promised.’
Auckland continues to dominate New Zealand skies with 72 long-term cranes, 55% of all cranes observed across the seven key centres in New Zealand. Twenty-five new cranes have been erected and 24 have been removed from projects nearing completion.
Residential cranes dominate the skyline
Residential cranes continue to dominate the skyline with almost 70% of all cranes assisting to reduce the supply gap in residential housing, including private, student accommodation and aged-care residential. Residential cranes can be seen in 20 different suburbs around Auckland with a further 30 cranes within a 2km radius of the CBD.
Auckland’s largest current development projects, Commercial Bay and the NZ International Convention Centre sites, have both added four new tower cranes since our last index. Commercial cranes account for ten cranes, down from 13 in our last publication.
Mr Haines continued, ‘From our observations in Auckland, Fletcher Construction lead the way with 14 long-term cranes currently operating. Dominion Constructors have eight tower cranes and Hawkins have five cranes on sites in Auckland.’
Wellington hits a new high
Wellington’s crane index has reached a new high in Q4 2017 of 217, up 30% since our last publication. This new high reflects the rise in work put in place across Wellington over the past four years. The volume of construction work increased from $1.1b in the year ending June 2013 to $1.6b in 2017, a 45% increase. Work put in place over the 12 months to June 2017, rose by 26% over 2016 levels.
New developments with cranes include Newtown School in Riddiford Street, apartments in Molesworth Street and social housing apartments in Taranaki St. Additional cranes have commenced on Waterloo Quay and Precinct Properties Bowen Campus building.
FURTHER INFORMATION: