Rider Levett Bucknall (RLB) is today celebrating the 20th edition of the RLB Crane Index®.
With the construction industry generating over $360B in revenue annually, equating to 9% of Australia’s GDP, it has long been seen as a significant contributor to Australia’s economy. The RLB Crane Index® was created 10 years ago as a simple indicator of the state of both the construction industry and country’s economic health.
Domenic Schiafone, RLB’s Oceania Director of Research and Development commented, ‘According to today’s release of the Q1 2022 RLB Crane Index®, crane numbers across the country rose sharply in the past six months by 95 cranes (up 13%) to reach a record 813 cranes. This is the highest number of cranes ever recorded across Australia since the inaugural count in 2012, twenty editions ago.’
Crane numbers prove resilience of industry
‘What this shows is the remarkable resilience of our industry. The challenges have been numerous since the outbreak of COVID-19 two years ago – supply chain disruptions, increased shipping and freight costs, material price rises, workers home sick or in isolation, pressure on local labour resources and then there’s been the rain. Yet, the industry is still able to produce these record crane numbers,’ he said.
Domenic Schiafone
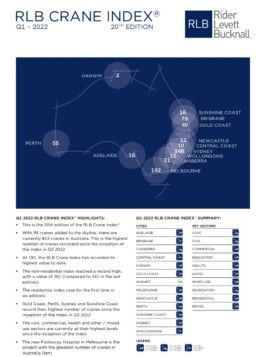
Looking around the country, Sydney continues to be the main driver of the crane count. Of the 813 cranes sighted across Australia, 348 were in Sydney, 192 were in Melbourne, 79 were in Brisbane, 55 were in Perth, 40 on the Gold Coast, 31 in Canberra, 16 in both Adelaide and the Sunshine Coast, 12 in both Wollongong and Newcastle, two were in Darwin with zero cranes in Hobart.
Construction work done for the calendar year 2021 was up by 1.8%, or $3.7B, across Australia compared to 2020. Total residential work done was up 4.9%, or $3.5B, non-residential activity was down by 1.4% or $0.7B while engineering activity was up by 0.9%.
Record level of residential approvals across Australia
Strong growth in approval levels through 2021 saw a lift in the total value of approvals of 22% across the nation. Multi-level apartments (+21%), houses (+31%), health (+97%) and industrial (+27%), all significantly contributed to this increase.
Strong crane growth was seen across all sectors with the non-residential sector recording another strong result at recording its fourth record high over the past four editions of the crane index.
With record levels of residential approvals across the country, the residential index rose for the first time in six editions.
Government stimulus measures helping the economy
Domenic continued, ‘Both Federal & State Governments’ stimulus measures have assisted the economy as the residential sector has seen a large increase of 63 crane numbers in this edition. The residential index rose by 14%, the highest value since Q3 2019. Residential cranes now number 506, or 62% of all cranes across Australia.’
‘Multi-storey residential developments have recovered from their fourth consecutive fall in previous editions, mirroring the rise in building approvals and work done in this subsector during 2021,’ he added.
The non-residential index continued its rising level to record a lift from 241 in Q1 2021 to now stand at 267, a 11.6% increase, representing a lift of 32 cranes. This index result is another record level since the inception of the index.
Hardest hit tourism, retail and commercial record rises
The industries hit hardest by the lockdown during 2020 and 2021, namely tourism, retail and commercial recorded rises in crane numbers in this edition. Commercial rose by 10 cranes, hotels by one and retail by two.
The civil and civic sectors saw a small drop with a loss of four cranes each. Recreation fell by two cranes. Health (up 8) and mixed use / other (up 18), both recorded increases in crane numbers across the country.
Sydney still main driver of crane count
Domenic continued, ‘Australia’s crane capital, Sydney, saw crane numbers increase by 53 (56% of the total increase recorded) to total 348 cranes. This is the highest number of cranes ever recorded for the city and represents 43% of all cranes across the country.’
Sydney’s residential sector has jumped this count to record 100 additions and the removal of 59 cranes, bringing the total count to 242 cranes across Sydney. Residential cranes make up almost 70% of all cranes across Sydney,’ he said.
Across Sydney’s five main regions, increases were seen in all regions except for the West. The North for the first time since Q1 2019 has the most cranes of all Sydney regions with 101 or 29% of all cranes in Sydney.
The largest developments based on crane numbers are the sites with four cranes including: One Sydney Harbour (Barangaroo) and 180 George (Parramatta).
Perth and Melbourne recorded double figure lifts in crane numbers of 18 and 12 respectively. On a percentage basis both Adelaide and Perth recorded crane rises of more than 40% over Q3 2021 results.
Perth records highest crane count since start of index
Perth has seen a 129% increase in the RLB Crane Index® since the lows of Q1 2017. This edition has seen a surge of 48% since the last publication. Total crane numbers in Q3 2017 were 24 and 37 at Q3 2021. Current crane numbers working in Perth number 55, the highest crane count since the inception of the index.
The Gold Coast RLB Crane Index® has increased to 267 compared to 233 seen last count. This is now the region’s highest index value since the inception of the index (40 cranes in total). The residential sector continues to dominate the region with more than 95% of all Gold Coast cranes.
Domenic concluded, ‘The forward pipeline remains very strong with building approvals for the country being very positive. With the current increases in crane numbers across the country, time will tell if these numbers will be maintained into the future.’
Developers try to predict the future
‘Given the varying levels of escalation across the country that has occurred in the last 12 months, developers are trying to ‘crystal ball’ future pricing risk to determine whether to proceed with builds or not. Some may be considering waiting in the hope of a more stable environment with future capacity in the market and more supply and cost certainty. However, recent Shanghai lockdowns, and how open borders and migration will impact the construction sector over the next 12 months, highlights there are many ‘unknowns’ still ahead’ he said.
FURTHER INFORMATION: