The 108 long-term cranes across Auckland and 78 residential cranes across New Zealand results in a record 150 cranes across the main centres, according to RLB Crane Index®.
New Zealand’s construction market has enjoyed a remarkably successful past two years, despite the numerous impacts of COVID-19. The industry has weathered lockdowns, supply chain delays, increased shipping and freight costs, material price rises, and pressure on local labour resources. Yet today, there are a record 150 tower cranes standing tall across NZ. This is mainly attributable to a record 108 cranes in Auckland and a record 78 residential cranes across the country.
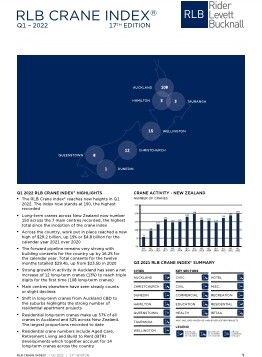
According to today’s release of the Q1 2022 RLB Crane Index®, New Zealand now has 150 long-term cranes on construction sites across the seven main centres, up from 144 in Q3 2021. 108 cranes in Auckland, 15 in Wellington, 12 in Christchurch, 8 in Queenstown, 3 in Tauranga, 3 in Hamilton, and 1 in Dunedin.
Rider Levett Bucknall Director Chris Haines said, ‘The record crane numbers of the latest RLB Crane Index are extraordinary, given the numerous challenges our industry has had to endure these past two years but it’s great to see the industry so resilient and buoyant.’
Auckland the main driver of record crane numbers
‘This surge in activity, especially in the North Island, has seen the RLB Crane lndex® reach a new high of 150 long-term cranes across the country. The previous record number of cranes was reached in Q1 2019 with 148,’ he added.
According to the RLB report, Auckland’s cranes continue to grow and be the main driver of the record crane numbers with the city being the only region to record a growth in numbers. Cranes across Auckland now number 108, the first time that triple figures have been reached. The additional 12 net cranes have resulted in a record number of cranes across the region.
All the seven key regions in New Zealand continue to record cranes working on sites. On the South Island, both Dunedin and Queenstown maintained their previous numbers with Christchurch down by two cranes. Whilst Auckland is experiencing record long-term cranes, the North Island saw both Hamilton and Wellington fall by one long-term crane each, and Tauranga down two.
Residential crane numbers show strength of sector
Chris continued, ‘Residential crane numbers continue to highlight the current strength of the sector, recording the highest number of cranes since the commencement of the index. Seventy-eight long-term residential cranes (52% of the total count) are now assisting with new dwellings across the country. Since the last edition, 36 new long-term residential cranes commenced and 19 were removed from sites nearing completion. This includes 14 cranes in aged care, retirement living and the new Build to Rent (BTR) sector.’
‘For the first time in the 17 editions of the index, residential cranes on site account for more than 50% of all cranes sighted within the seven key regions included in the count. Furthermore, residential cranes account for 57% of the Auckland region’ he said.
Easing in property prices due to tax changes and tighter lending rules
However, headwinds may be building in the residential sector with an easing in property prices and sales volumes in the last quarter. This is following the government tax changes introduced last year impacting landlords by removing the tax rebate on loan interest, together with a longer bright line test on second properties.
Bank lending rules have also tightened with additional stress testing and equity requirements. Interest rates are slightly up, with the expectation of additional increases. Bank lending on residential development projects is tightening with the banks looking for time and cost certainty on pricing in a market with volatile material price fluctuations.
Forward pipeline very strong with building consents up
RLB’s non-residential index has fallen in this edition but continues to be boosted by strong civil growth across the country together with the growth of data centres counted within the miscellaneous sector. Non-residential cranes decreased by a net 11 long-term cranes across the country.
Chris concluded, ‘The forward pipeline remains very strong with building consents for the country up by 16.2% for the calendar year. Total consents for the twelve months totalled $29.4b, up from $23.5b in 2020. All regions’ consents are up from the previous 12 months which gives confidence for future strong activity. Both residential and non-residential consents increased substantially over the past 12 months with increases of 28.7% and 16.2% respectively.
Many ‘unknowns’ still ahead for the next 12 months
‘Whilst we are seeing a strong pipeline generally, most non-residential sectors are almost hoping the residential sector will ease to assist with the labour and material shortages that have largely been driven by the flat-out residential sector which is around 50% of the construction market.’
‘Given the escalation that has incurred in the last 15 months, some big projects are trying to ‘crystal ball’ future pricing and the extent of future fluctuation risk to determine whether to proceed with builds or not. Some may be considering to wait in the hope of more future capacity in the market and more price and material supply time and cost certainty. However, recent Shanghai lockdowns, and how open borders and migration will impact the construction sector over the next 12 months, shows there are definitely many ‘unknowns’ still ahead,’ he added.
FURTHER INFORMATION: