While Trump has won the US Presidency, Auckland’s construction boom has exploded to trump New York, Washington and Los Angeles with the number of cranes erected across the city’s skyline, according to Rider Levett Bucknall’s Q4 2016 RLB Crane Index® released today.
‘To confirm that Auckland construction is booming you need only glance across the city’s vibrant skyline, where a record 64 cranes tell the story. We have more cranes in place than any of the 11 US cities that we track with our RLB Crane Index,’ said Chris Haines, a Director of RLB in Auckland.
‘With President Trump having a development background, the global property industry is no doubt curious to see what new measures he puts into place to stimulate business and the US construction industry”, ‘he added.
Auckland the crane hotspot
The latest RLB Crane Index shows Auckland is streets ahead of the recent crane count in New York (28), Washington DC (29) and Los Angeles (40 cranes) in addition to other key US markets of San Francisco (24), Seattle (58), Chicago (26), Denver (21), Portland (22), Phoenix (10), Boston (14), and Honolulu (13).
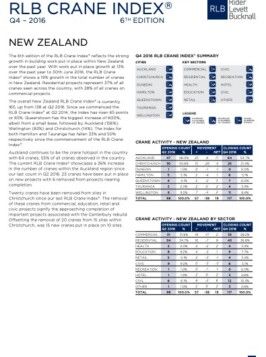
In the past 6 months, 23 new long term cranes have been erected in Auckland, while 6 have been removed as site work on construction projects came to an end. That’s a net increase of 17 cranes, or 36% since Q2 2016’s 47 cranes.
Chris continued, ‘Auckland continues to be the crane hotspot in the country with 64 cranes, 55% of all cranes observed in the country. The construction industry in Auckland is now stretching the supply chain across the North Island. There is increased activity from Australian subcontractors and suppliers, and overseas steel fabricators. There remains substantial labour resource and material supply concerns for our prolonged building boom.’
The Q4 2016 RLB Crane Index® has identified a total of 117 cranes currently up across New Zealand, an increase of 19 since Q2 2016. While Auckland activity is most buoyant with 64 cranes, this market is followed by Christchurch (25), Wellington (11), Queenstown (7), Hamilton (6), Tauranga (4). Dunedin currently has no cranes in operation although the Dental School tower goes up in the new year.
Residential sector soars
Residential projects represent 37% of all cranes seen across the country, with 28% of all cranes on commercial projects.
According to the RLB Crane Index, Auckland’s residential sector cranes account for 59% of all cranes in Auckland and 35% nationally. The residential sector continues to soar with a net increase of 9 cranes after 3 were removed and 12 new cranes commencing on new projects.
New cranes have been observed on projects at Anzac Avenue, the Wynyard Quarter, Whitaker Place, Campbell Road in Onehunga, New North Road in Eden Terrace, Howe St in Ponsonby, on the corner of Central Road and New North Road in Kingsland, and in Rosedale. An additional crane was installed on the Alexander Park development.
The commercial sector saw the addition of 4 cranes, with 4 cranes continuing on projects, bringing the total count within the sector to 8 cranes. Commencements saw cranes put in place at Gt. North Road, Smales Farm and Gt. South Road in Greenlane. Continuing projects include both Datacom and Building 5A at the Wynyard Quarter. A crane is also due to be erected in November on the new Sylvia Park office tower that has not yet made the index.
Within education, 3 cranes were added at Unitec, University ofAuckland and King’s School. These complemented the 2 cranes at Auckland University of Technology. The retail sector added a crane at the new Bunnings on Gt. North Road and the civil sector saw the addition of 2 new cranes during the period.
Christchurch construction growth continues
The value of building work put in place for Auckland has seen continuing growth since 2012. Since 2012 Auckland has seen nearly an 80% rise in total work put in place, with residential increasing 106% and non-residential work up by 48%.
With 25 cranes erected across its skyline, Christchurch is the second busiest construction city in New Zealand. Twenty cranes have been removed from 15 sites in Christchurch since our last RLB Crane Index®, whilst 15 new cranes have been put in place on 10 sites. The removal of these cranes from commercial, education, retail and civic projects signify the approaching completion of important projects associated with the Canterbury rebuild.
Queenstown has almost doubled the numbers of cranes since the last RLB Crane Index®. Seven cranes can now be seen in the region around Queenstown across 6 sites. Both the Commercial and Civil sectors have each had cranes erected on new projects. Two commercial cranes have commenced on sites at Beach Street and Five Mile Stage 2 and 2 cranes have commenced works at Kawarau Bridge within the civil sector.
Wellington’s cranes have increased to a total of 11, up from 9. Five cranes have been removed from sites and 7 new cranes have been put in place. The commercial sector has 8 cranes in place, 73% of all Wellington’s cranes.
Tauranga has seen an increase of 2 long-term cranes on a Civil’s tunnel underpass project to a total of 4 cranes, and there are a number of large Bay of Plenty projects in the pipeline that should see an increase in crane activity in this region.
Hamilton saw a gain of 1 crane to a total of 6 cranes, with the commencement of the Laminex site in Te Rapa. Tauranga increased to 4 cranes, with 2 cranes remaining on sites in Cameron Road and the Bay of Plenty Polytechnic, Windermere Campus, and 2 cranes put in place at the Maungatapu Tunnel underpass.
FURTHER INFORMATION: