Adelaide, Canberra, Gold Coast and Sydney continue to grow, while Melbourne and Brisbane take a step back
The Rider Levett Bucknall Q3 2016 RLB Crane Index® released today highlights the continued strength of the residential apartment sector across Australia, underpinned by persistent demand for inner-city living, low interest rates, and strong investment sales.
Sydney continues to be the driver of crane activity within the country with 46% of all cranes, up from 44% at last count. In Melbourne and Brisbane crane numbers fell as projects get close to completion. Now in its 9th edition, the bi-annual RLB Crane Index® was created by the firm as a simple indicator of building activity and the general health of our construction markets.
Latest RLB Crane Index® still identifies greatest amount of crane activity (663) since launch
Stephen Ballesty, RLB’s Director of Research & Development commented, ‘The Q3 2016 RLB Crane Index® has identified a total of 663 cranes currently erected across Australia’s capital cities (a 1.5% increase since Q2 2016). Despite some media reports, the construction industry cranes are not showing any signs of slowing.’
Mr Ballesty added, ‘335 new tower cranes were erected across Australia’s skylines in the past six months, highlighting very strong levels of activity over the short term.’
‘The high-rise residential apartment market is as hot as ever, with our research identifying 81.3% of all cranes on residential projects, while only 5.3% are on commercial projects. Cranes on the east coast of Australia amount to 90% of all cranes sighted in Australia,’ he said.
Sydney still the hottest construction market
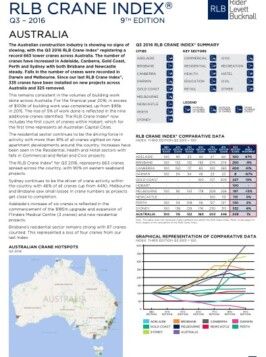
The Q3 2016 RLB Crane Index® continues to highlight the positive sentiments of the construction industry. Activity is most buoyant in Sydney with 305 active cranes and Melbourne with 128. They are followed by Brisbane (95), Perth (48), Gold Coast (34), Canberra (24), Adelaide (15), Newcastle (9), and Darwin (1). Hobart (4 cranes) has been included for the first time.
Sydney remains the leader, with the greatest number of cranes in the residential (258), commercial (15), and civic (10) sectors. Melbourne led the retail sector (3).
The RLB Crane Index® hotspots map
The positive growth of crane numbers across the country, corresponds with the growth of residential construction work done. Significant increases in the volume of apartment construction is enabling the growth of cranes across the skyline of Australia.
The RLB Crane Index® has continued its hotspots map, which offers a pictorial representation of the collected data for each city using a heat map indicator to indicate the level of crane activity.
The size of hotspot is relative to the scale of the map and is not an indication of the crane count in that position. The map uses blue to indicate a lower crane activity, and the brighter red insert to indicate higher crane activity.
The location of the hotspots are indicative only and have been positioned to convey the general spread of cranes within a city. The levels of intensity are calculated on a map by map basis and should not be compared between different cities.
FURTHER INFORMATION: